Hope all is well and everyones summer is off to a good start. For this note I am going to go with a different approach. In prior posts, I have gone with a macro themes and trade ideas. For this year, that has been slowing U.S. economic growth and a rally in rates, especially in the back end. So this note will encompass two distinct shifts; first it will not be me presenting a trade idea necessarily, and second, one of my mentors conveyed to me that I should "spell things out and not use abbreviations/vernacular so often," so in this post I will also attempt to be clearer with my thoughts. As Tolstoy said, "true life is lived, when tiny changes occur."
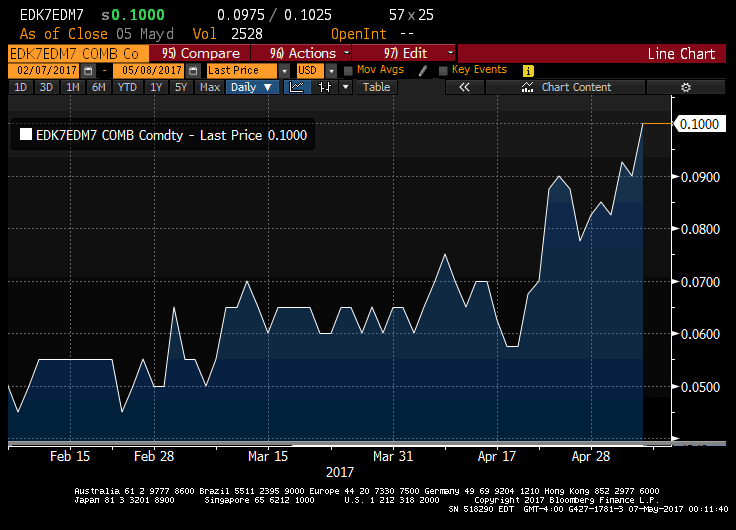
The topic I am grappling with is what has been a refunding of dollar liquidity since the end of 2016. Of course my core competency is typically in broader macro and not money markets, but the macro consequences of this "dollar" move has forced me to do some homework. I hinted at this topic in my last post, when I talked about the potential for "counter flow" in USTs on the back of cheap dollars. So, this year alone, the rush of dollar liquidity has led to, FRA-OIS back near 11, which has caused a lot of suffering for ed$ puts, cross currency basis swaps (XCCY) are significantly tighter, EMFX is ripping and risk assets in the developed world have surged as financial conditions are near their easiest levels since 2014. The question the BIS has been asking, what unleashed all of this dollar liquidity? I am not sure it is definitely one thing, but this post focuses on one variable in specific, the US Treasury. Could have money market fund adjustments post 2a-7 normalized FRA-OIS, could the increased oil price post OPEC cuts have helped free up some petrodollars, could China's capital controls have kept Asian currencies in check, did the expectation of regulatory relief in the form of easing Basel III from the new administration play a role in increasing bank leverage. All are possibilities, but I am going to focus on the role of Treasury and why this reliquification of dollars is likely unsustainable if underfunded Uncle Sam is the culprit. The biggest reason I feel strongly about the US Treasury being a key variable in this dollar liquidity equation is, the evidence (presented below) suggests that something changed in late December of 2016 in terms of dollar funding, this happens to coincide with the Treasury's cash balance falling by around $350b, providing the global banking system with much needed dollars. The question is, if the treasury needs to reload in terms of issuance, as they will likely have to do later this year, does that suck up all of this dollar liquidity. What has stoked this fear for me is that the Fed is looking likely to change their SOMA policy by year end as they cannot tolerate this relentless flattening in the curve (I do not believe a tepid b/s rolloff through caps will steepen the curve, I have touched on that in previous posts). The combination of b/s roll offs and Uncle Sam desperate for cash (need to extend debt ceiling) with twelve month trailing tax receipts negative, dollar liquidity could get soaked back up again and the dollar shortage theme will remerge.
Part of the reason I am fearful of this topic is, the knock on effect onto my core positions in rates is somewhat unknown to me. If dollar liquidity is again to recede, do USTs act as a guaranteed claim on USD long term, or does what I talked about last post, the potential for counter flow in this "cheap" dollar world end, and force trade surplus nations to cover their effective dollar shorts, i.e. selling dollar reserves. I guess my transition into Q3 and onwards could look to be long dollars, which is now becoming a consensus short. Monitoring Treasury refunding statements and debt ceiling developments will be crucial in assessing when this dollar liquidity train will halt and the right timing for putting on dollar longs. The knock on effects of this are significant to EM, China and thus the Fed.
How did we get here?
If one is to look at where dollar liquidity would manifest itself, for me, there are three key places. First, EMFX will always show you as EM is structurally short around $10.5T in dollars according to the BIS. Second, funding markets through FRA-OIS and XCCY will give you a decent idea. Third, is in FCI, as credit is so intercorrelated to commodities, dollar liquidity always plays a big role in determining financial conditions. In a paper last year, the BIS deemed the dollar as the new VIX. Well, since the middle of December, the Fed has hiked twice and raised the dots and their December meeting in hopes of tightening financial conditions, at least to an extent. The response has been remarkable, from EM to credit spreads in the U.S.
Mnuchin's Unintentional dollar QE. US TSY Cash Balance vs FRA-OIS

While the Fed was busy tightening the screws, the Treasury, in hopes of avoiding the debt ceiling unleashed a wave of dollar liquidity by paying down its cash balance. The ripple effect has cost ed$ put buyers a lot of money, as FRA-OIS has been crushed by this rush of liquidity. So in a sense, during the Fed's "tightening" cycle, we are witnessing the easiest financial conditions since '14, a bull market in EMFX and credit spreads near their tights. What has contributed to me thinking the big catalyst in this liquidity rush, is the massive drawdown in the Treasury cash balance, as the response in timing seems to match the beginning of Q1.
Something Changed at the very Beginning of Q1

Rip fest in dollar liquidity seen in XCCY, coincided with TSY move in Cash Balance

It just cannot be coincidental that as the Treasury essentially flooded the system with +350B of reserves, there was massive narrowing in $/DM FX basis. What has also helped, especially in the EUR basis, is the relative calm in the banking sector. Towards the end of last summer, when DBK was collapsing, EUR 3 month XCCY was blowing out, as funding pressures reverberated throughout the European banking system. As the EGB curve have steepened a bit, banks are hanging in. To me, curves, especially in the core, could be ripe for flattening as inflation slows. The ECB will conscious of this effect on the banks and pensions. Another reason why I like EUR shorts, what if receding dollar liquidity from increased Treasury issuance coincides with flattening curves in the core?
German Inflation (April # below) is in Trouble if China Slowing Persists

This chart already served me well going into the May flash HICP inflation number, but a slowing of Chinese imports will continue to weigh on price pressures in Germany. Given slowing inflation and carry+roll in the belly, it should stay relatively bid. This will only be enhanced if dovish Mario ignores scarcity concerns in his PSPP program.
EMFX v FRA-OIS, One in the Same


With domestic currencies on a tear, many EM countries have used this as a time to pickup some FX reserves, something they have been shedding since 2014. It is not surprising that this pick up has correlated to a collapse in FRA-OIS. In my last post I talked about the potential for this to occur in China, as the currency looked stable given interest rate differentials and "stabilization" in the capital account. Now, we are hearing China is looking to pickup some USTs. The problem is, if China is to experience dollar problems, like they did in the latter months of last year, the trickle effect in EM is significant. It is worth noting, the BIS assumes that 80% of foreign currency loans in China are USD denominated and half of the foreign debt owned by Chinese firms is in USD. As the rest of EM has done in Q1, Chinese firms effectively went massively short dollars in Q3 as foreign debt owed by Chinese firms skyrocketed to $1.2T in Q3. So the Fed could be beginning balance sheet reduction at the same time the Treasury is reloading its cash balance, and while all of this is going on, EM got massively short dollars again in the few quarters before. Q4 of this year should be most interesting if Treasury is really the cause of this abundance in dollar liquidity.
Credit Spreads near Tights and Financial Stress Index at lows

Post Treasury move reaction, highly visible in credit spreads and the Financial Stress Index. Both have compressed to their tightest levels since 2014. It is worth reminding, this move will encompass three Fed hikes after the June meeting next week. But, if your approach is that the bank funding has functionally replaced Tbills as the Treasury lowered supply, is it surprising that banks "feel" better, they just got a boat load of cheap liquidity.
Commercial Paper Outstanding Correlates to Asian Dollar Index

So as the Treasury frees up dollar liquidity, it makes sense for CP issuance to correlate to Asia FX. As LIBOR underperforms banks increase CP issuance, which they have basically had to as Tbill funding looks for an alternative. CP is also a key dollar funding source for foreign banks. As banks relevered, dollars were provided to the broader system and carry was aggressively chased.
To show how interconnected the Treasury is in all of this we can trace back. As the Treasury went through its cash balance and reduced bill issuance due to debt ceiling concerns, cash pools had to access the market for bill equivalents in o/n bilateral repo. This led to distortions in GC repo v LIBOR. After the Treasury's move at the beginning of Q1, this spread blew out as the lack of bill supply flooded the bilateral market with cash. As we can see, this spread is beginning to normalize.

It Does Not Look Sustainable, Treasury has to Reload and the Fed Lurks
What has become popular on the street is the Treasury's refunding statements. The May release drew a lot of macro interest. However, I think this interest was misplaced. The street seemed to be obsessed about 50 year bonds, something Mnuchin has hinted that he is inclined to pursue. Extending maturities makes sense, so the duration impact was obvious. Not surprisingly however, dealers were skeptical of the idea and seemed to prefer increasing issuance of longer dated maturities. This is not entirely surprising because without a change in capital requirements, it is more costly for dealers to warehouse long duration risk. However, this should have been side point. The real question is how does the Treasury reload in terms of refunding this year and when? Treasury needs to run a higher cash balance and Tbill issuance has to ramp to facilitate that. This will bring government back to doing what it does best, crowding out. What could make this worse is that the May TBAC assumption for the Fed was that SOMA changes would begin in June 2018, not this year. If the Fed is doing roll offs in SOMA at the same time issuance at the Treasury is ramping (would need to more issuance than expected if Fed moves on SOMA this year), dollar liquidity will come down significantly as these two sources of reserves are sucking it all up.
The topic I am grappling with is what has been a refunding of dollar liquidity since the end of 2016. Of course my core competency is typically in broader macro and not money markets, but the macro consequences of this "dollar" move has forced me to do some homework. I hinted at this topic in my last post, when I talked about the potential for "counter flow" in USTs on the back of cheap dollars. So, this year alone, the rush of dollar liquidity has led to, FRA-OIS back near 11, which has caused a lot of suffering for ed$ puts, cross currency basis swaps (XCCY) are significantly tighter, EMFX is ripping and risk assets in the developed world have surged as financial conditions are near their easiest levels since 2014. The question the BIS has been asking, what unleashed all of this dollar liquidity? I am not sure it is definitely one thing, but this post focuses on one variable in specific, the US Treasury. Could have money market fund adjustments post 2a-7 normalized FRA-OIS, could the increased oil price post OPEC cuts have helped free up some petrodollars, could China's capital controls have kept Asian currencies in check, did the expectation of regulatory relief in the form of easing Basel III from the new administration play a role in increasing bank leverage. All are possibilities, but I am going to focus on the role of Treasury and why this reliquification of dollars is likely unsustainable if underfunded Uncle Sam is the culprit. The biggest reason I feel strongly about the US Treasury being a key variable in this dollar liquidity equation is, the evidence (presented below) suggests that something changed in late December of 2016 in terms of dollar funding, this happens to coincide with the Treasury's cash balance falling by around $350b, providing the global banking system with much needed dollars. The question is, if the treasury needs to reload in terms of issuance, as they will likely have to do later this year, does that suck up all of this dollar liquidity. What has stoked this fear for me is that the Fed is looking likely to change their SOMA policy by year end as they cannot tolerate this relentless flattening in the curve (I do not believe a tepid b/s rolloff through caps will steepen the curve, I have touched on that in previous posts). The combination of b/s roll offs and Uncle Sam desperate for cash (need to extend debt ceiling) with twelve month trailing tax receipts negative, dollar liquidity could get soaked back up again and the dollar shortage theme will remerge.
Part of the reason I am fearful of this topic is, the knock on effect onto my core positions in rates is somewhat unknown to me. If dollar liquidity is again to recede, do USTs act as a guaranteed claim on USD long term, or does what I talked about last post, the potential for counter flow in this "cheap" dollar world end, and force trade surplus nations to cover their effective dollar shorts, i.e. selling dollar reserves. I guess my transition into Q3 and onwards could look to be long dollars, which is now becoming a consensus short. Monitoring Treasury refunding statements and debt ceiling developments will be crucial in assessing when this dollar liquidity train will halt and the right timing for putting on dollar longs. The knock on effects of this are significant to EM, China and thus the Fed.
How did we get here?
If one is to look at where dollar liquidity would manifest itself, for me, there are three key places. First, EMFX will always show you as EM is structurally short around $10.5T in dollars according to the BIS. Second, funding markets through FRA-OIS and XCCY will give you a decent idea. Third, is in FCI, as credit is so intercorrelated to commodities, dollar liquidity always plays a big role in determining financial conditions. In a paper last year, the BIS deemed the dollar as the new VIX. Well, since the middle of December, the Fed has hiked twice and raised the dots and their December meeting in hopes of tightening financial conditions, at least to an extent. The response has been remarkable, from EM to credit spreads in the U.S.
Mnuchin's Unintentional dollar QE. US TSY Cash Balance vs FRA-OIS

While the Fed was busy tightening the screws, the Treasury, in hopes of avoiding the debt ceiling unleashed a wave of dollar liquidity by paying down its cash balance. The ripple effect has cost ed$ put buyers a lot of money, as FRA-OIS has been crushed by this rush of liquidity. So in a sense, during the Fed's "tightening" cycle, we are witnessing the easiest financial conditions since '14, a bull market in EMFX and credit spreads near their tights. What has contributed to me thinking the big catalyst in this liquidity rush, is the massive drawdown in the Treasury cash balance, as the response in timing seems to match the beginning of Q1.
Something Changed at the very Beginning of Q1

So effectively, as the Treasury's cash balance was taken down, cross currency basis swaps tightened. One of the reasons I find it likely that this catalyst is more likely then say a regulatory shift that would free up bank balance sheets for arbitrage, is that these changes take time, and as we see above, the three month basis in EUR has moved considerably tighter. So to me, it looks more likely that Treasury was the catalyst in freeing up cheaper dollars.

It just cannot be coincidental that as the Treasury essentially flooded the system with +350B of reserves, there was massive narrowing in $/DM FX basis. What has also helped, especially in the EUR basis, is the relative calm in the banking sector. Towards the end of last summer, when DBK was collapsing, EUR 3 month XCCY was blowing out, as funding pressures reverberated throughout the European banking system. As the EGB curve have steepened a bit, banks are hanging in. To me, curves, especially in the core, could be ripe for flattening as inflation slows. The ECB will conscious of this effect on the banks and pensions. Another reason why I like EUR shorts, what if receding dollar liquidity from increased Treasury issuance coincides with flattening curves in the core?
German Inflation (April # below) is in Trouble if China Slowing Persists

This chart already served me well going into the May flash HICP inflation number, but a slowing of Chinese imports will continue to weigh on price pressures in Germany. Given slowing inflation and carry+roll in the belly, it should stay relatively bid. This will only be enhanced if dovish Mario ignores scarcity concerns in his PSPP program.
EMFX v FRA-OIS, One in the Same

What has become clear is that something reversed EM flows towards the end of last year. Going into December, EM was a consensus short as the Fed was poised to steer more hawkish and the dollar was advancing. But, following the Treasury's move to stave off debt ceiling, dollar liquidity flooded the system and EMFX ripped. Of course this was helped by increased Chinese aggregate demand on the back of expanded fiscal moves in the industrial sector, but that was already taking place on a lagged effect since Q3. Something staved off a dollar shortfall in Asia, my feeling is it was the US Treasury, unbeknownst to them. The question is, why did EMFX ignore a hawkish FOMC path at the same time the US Treasury was staving off debt ceiling by paying down its cash balance. Unfortunately for EM, this has created a false sense of dollar calm. So far this year, we have seen record USD issuance. in Q1, EM governments issued a record $179B in USD denominated debt. Effectively EM on quarterly basis, went limit short dollars and on what appears to be a false sense of liquidity. If this dollar liquidity is really just temporary, crowded EMFX and rates could be hit hard later this year, and this space is already crowded on the long side. If Treasury issuance is to ramp, I will be looking back at some shorts in Asia FX, especially currencies with poor FX reserve adequacy levels.
EMFX Carry Returns (%) Since Treasury led Dollar Liquidity Wave, Coincidence?

Forwards Curves in TWD and KRW, Big Move since pre-Dec FOMC

This could set up for some decently convex option structures in Asia FX, if this paradigm of cheap dollars is to shift later this year.
EMFX Carry Returns (%) Since Treasury led Dollar Liquidity Wave, Coincidence?

Forwards Curves in TWD and KRW, Big Move since pre-Dec FOMC

This could set up for some decently convex option structures in Asia FX, if this paradigm of cheap dollars is to shift later this year.
Fra-OIS (inv) v 10 EM country FX reserves

With domestic currencies on a tear, many EM countries have used this as a time to pickup some FX reserves, something they have been shedding since 2014. It is not surprising that this pick up has correlated to a collapse in FRA-OIS. In my last post I talked about the potential for this to occur in China, as the currency looked stable given interest rate differentials and "stabilization" in the capital account. Now, we are hearing China is looking to pickup some USTs. The problem is, if China is to experience dollar problems, like they did in the latter months of last year, the trickle effect in EM is significant. It is worth noting, the BIS assumes that 80% of foreign currency loans in China are USD denominated and half of the foreign debt owned by Chinese firms is in USD. As the rest of EM has done in Q1, Chinese firms effectively went massively short dollars in Q3 as foreign debt owed by Chinese firms skyrocketed to $1.2T in Q3. So the Fed could be beginning balance sheet reduction at the same time the Treasury is reloading its cash balance, and while all of this is going on, EM got massively short dollars again in the few quarters before. Q4 of this year should be most interesting if Treasury is really the cause of this abundance in dollar liquidity.
Credit Spreads near Tights and Financial Stress Index at lows

Post Treasury move reaction, highly visible in credit spreads and the Financial Stress Index. Both have compressed to their tightest levels since 2014. It is worth reminding, this move will encompass three Fed hikes after the June meeting next week. But, if your approach is that the bank funding has functionally replaced Tbills as the Treasury lowered supply, is it surprising that banks "feel" better, they just got a boat load of cheap liquidity.
Commercial Paper Outstanding Correlates to Asian Dollar Index

So as the Treasury frees up dollar liquidity, it makes sense for CP issuance to correlate to Asia FX. As LIBOR underperforms banks increase CP issuance, which they have basically had to as Tbill funding looks for an alternative. CP is also a key dollar funding source for foreign banks. As banks relevered, dollars were provided to the broader system and carry was aggressively chased.
To show how interconnected the Treasury is in all of this we can trace back. As the Treasury went through its cash balance and reduced bill issuance due to debt ceiling concerns, cash pools had to access the market for bill equivalents in o/n bilateral repo. This led to distortions in GC repo v LIBOR. After the Treasury's move at the beginning of Q1, this spread blew out as the lack of bill supply flooded the bilateral market with cash. As we can see, this spread is beginning to normalize.

It Does Not Look Sustainable, Treasury has to Reload and the Fed Lurks
What has become popular on the street is the Treasury's refunding statements. The May release drew a lot of macro interest. However, I think this interest was misplaced. The street seemed to be obsessed about 50 year bonds, something Mnuchin has hinted that he is inclined to pursue. Extending maturities makes sense, so the duration impact was obvious. Not surprisingly however, dealers were skeptical of the idea and seemed to prefer increasing issuance of longer dated maturities. This is not entirely surprising because without a change in capital requirements, it is more costly for dealers to warehouse long duration risk. However, this should have been side point. The real question is how does the Treasury reload in terms of refunding this year and when? Treasury needs to run a higher cash balance and Tbill issuance has to ramp to facilitate that. This will bring government back to doing what it does best, crowding out. What could make this worse is that the May TBAC assumption for the Fed was that SOMA changes would begin in June 2018, not this year. If the Fed is doing roll offs in SOMA at the same time issuance at the Treasury is ramping (would need to more issuance than expected if Fed moves on SOMA this year), dollar liquidity will come down significantly as these two sources of reserves are sucking it all up.

Source* TBAC Presentation to Treasury in May
The Fed's balance sheet shifts would have its own effects on dollar liquidity as there are significant ramifications on money markets, bank deposits, IOER, RRP and increased demand for HQLAs (high quality liquid assets). A reduction in the overall size would force banks to buy more USTs to satisfy their Liquidity Coverage Ratios for HQLAs, which also sucks liquidity from the system. So banks could be changing IOER balances for HLQAs at the same time as the Treasury drastically increases Tbill issuance to normalize their cash balance post debt ceiling. This feels like trouble.
Just a reminder, according to the BIS, a stronger USD leads to wider Covered Interest Parity deviations in cross border bank lending. Bruno and Shin (2015b) model.

"A stronger US dollar is associated with wider CIP deviations and lower growth of cross-border bank lending denominated in dollars. We interpret the magnitude of CIP deviations as the price of bank balance sheet capacity and dollar-denominated credit as a proxy of bank leverage, and argue that such a triangular relationship exists because of the impact of the dollar on the shadow price of bank leverage."
BIS November '16: The dollar, bank leverage and the deviation from covered interest parity
(Stefan Avdjiev, Wenxin Du, Catherine Koch and Hyun Song Shin)
The Rates Conundrum. If Dollar Becomes a Problem post Debt Ceiling.
Just to leave you with a thought, as I will likely spend my summer trying to figure out if a "dollar" event is to transpire, what are the effects on US rates. Can the dollar rise with falling rates? Well it did in '92-'93....... With that said, back end USTs should continue to rally as 2.15 still does not properly reflect growth and inflation both below 2% for 2017, and Fed that seems determined to get off the zero lower bound. See previous posts for more on my US macro view.

Thanks for reading and all the best,
Jonathan Turek